Most teams start with Jira Dashboards. A dashboard is created, gadgets are added, filters are configured. A burndown chart is displayed. At the beginning, this is enough.
But over time, requirements become more complex:
This is where Jira Dashboards begin to require increasingly more manual effort. Filters get duplicated, JQL becomes more complex, gadgets multiply, and data gets exported to Excel.

Before comparing solutions, it is important to understand what “Jira reporting” includes out of the box.
Native Jira reporting consists of several layers:
Built-in reports work only within a specific board or project. Gadgets are widgets that display filter results or individual metrics. Dashboards are layouts composed of multiple gadgets. Filters and JQL are the mechanism that actually powers most custom reports.
This architecture works well for basic visibility. But as complexity grows, another issue appears — reports must be assembled, maintained, and frequently rebuilt.
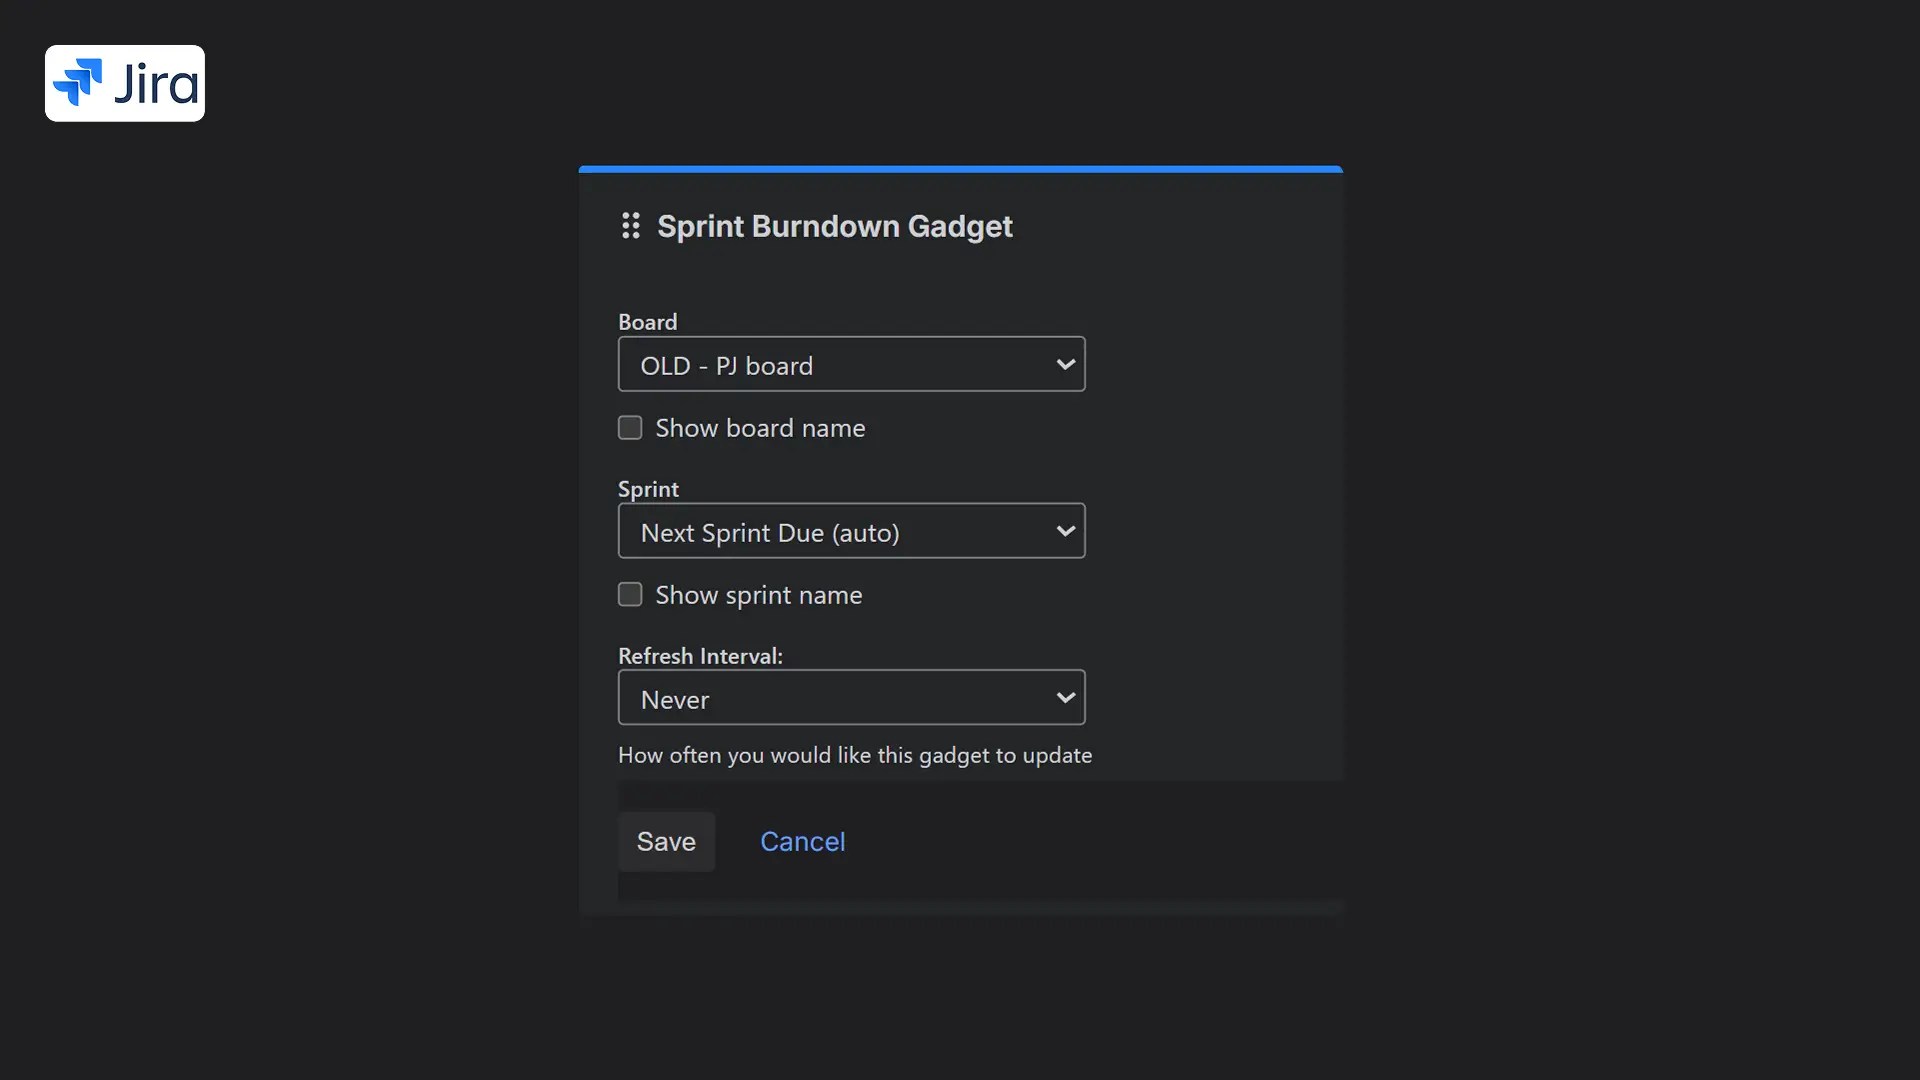
Jira Dashboards are a builder — you assemble reports from separate blocks.
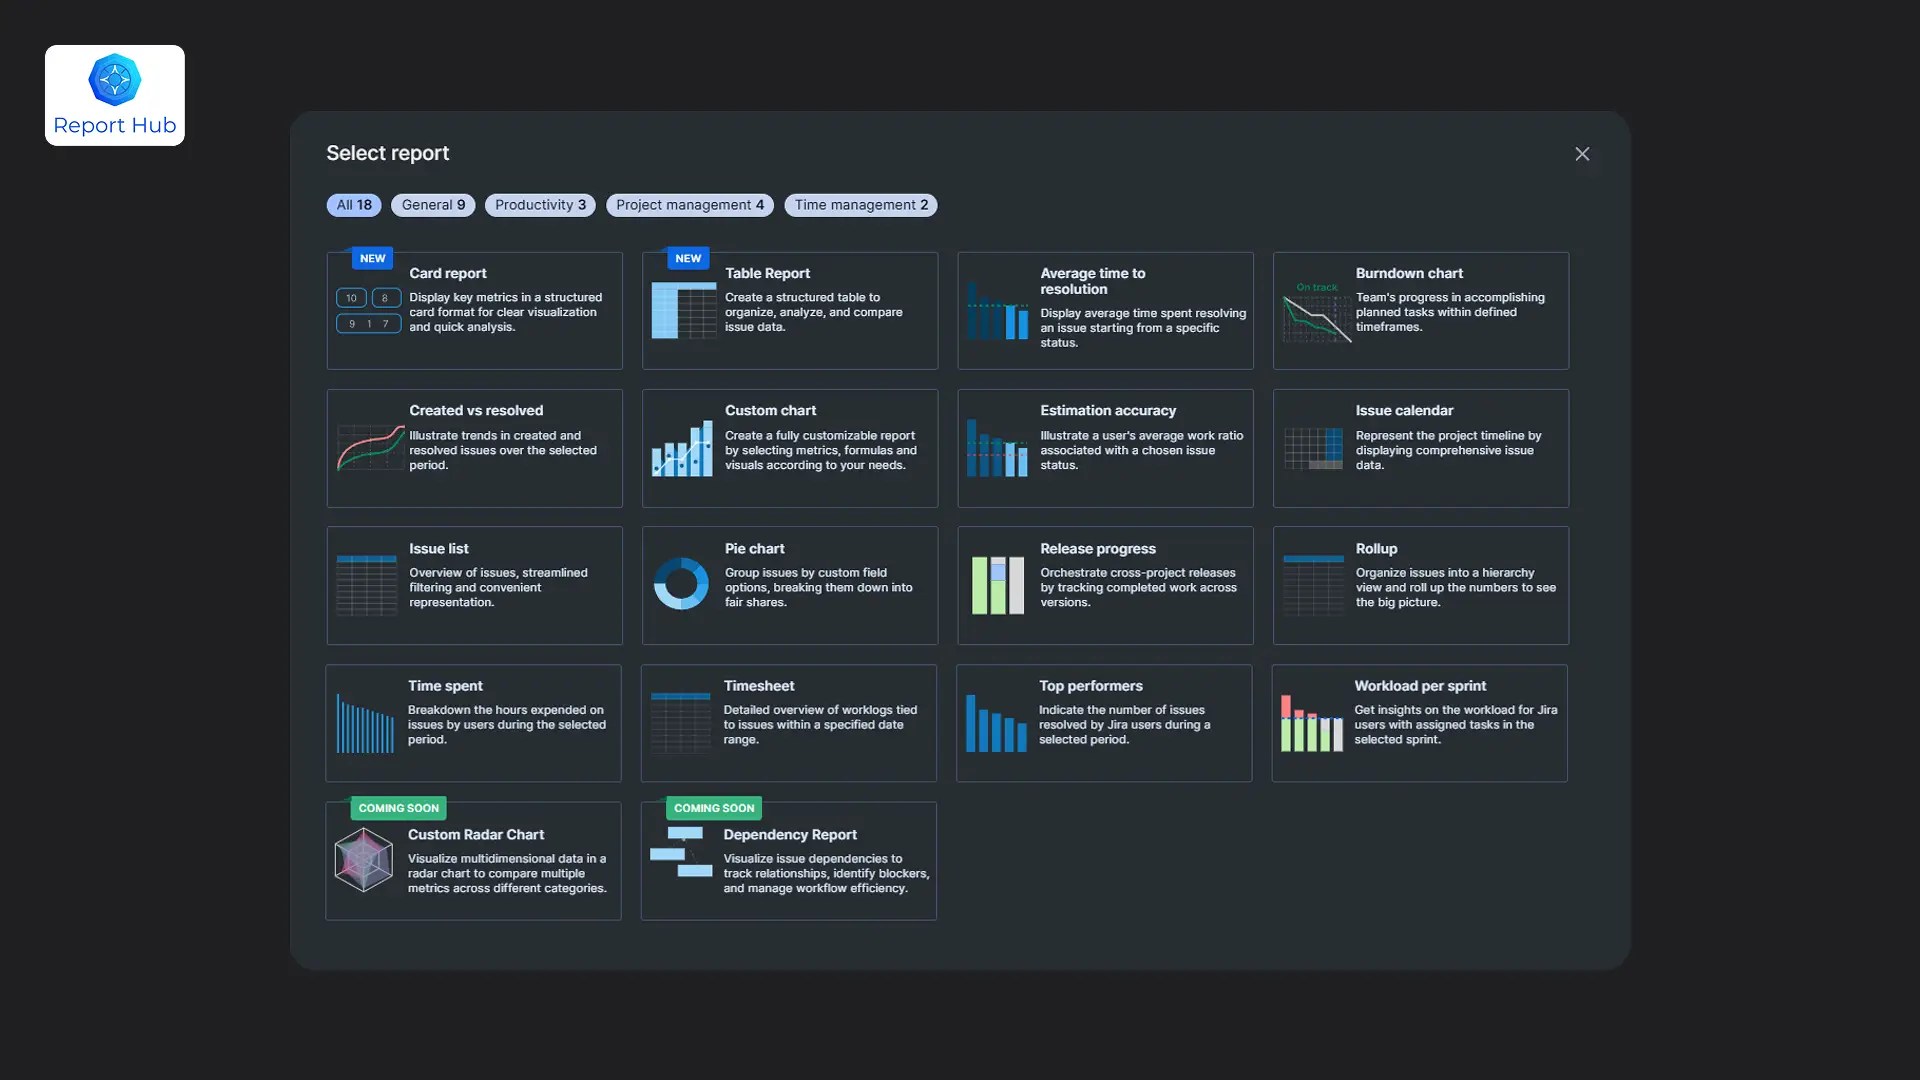
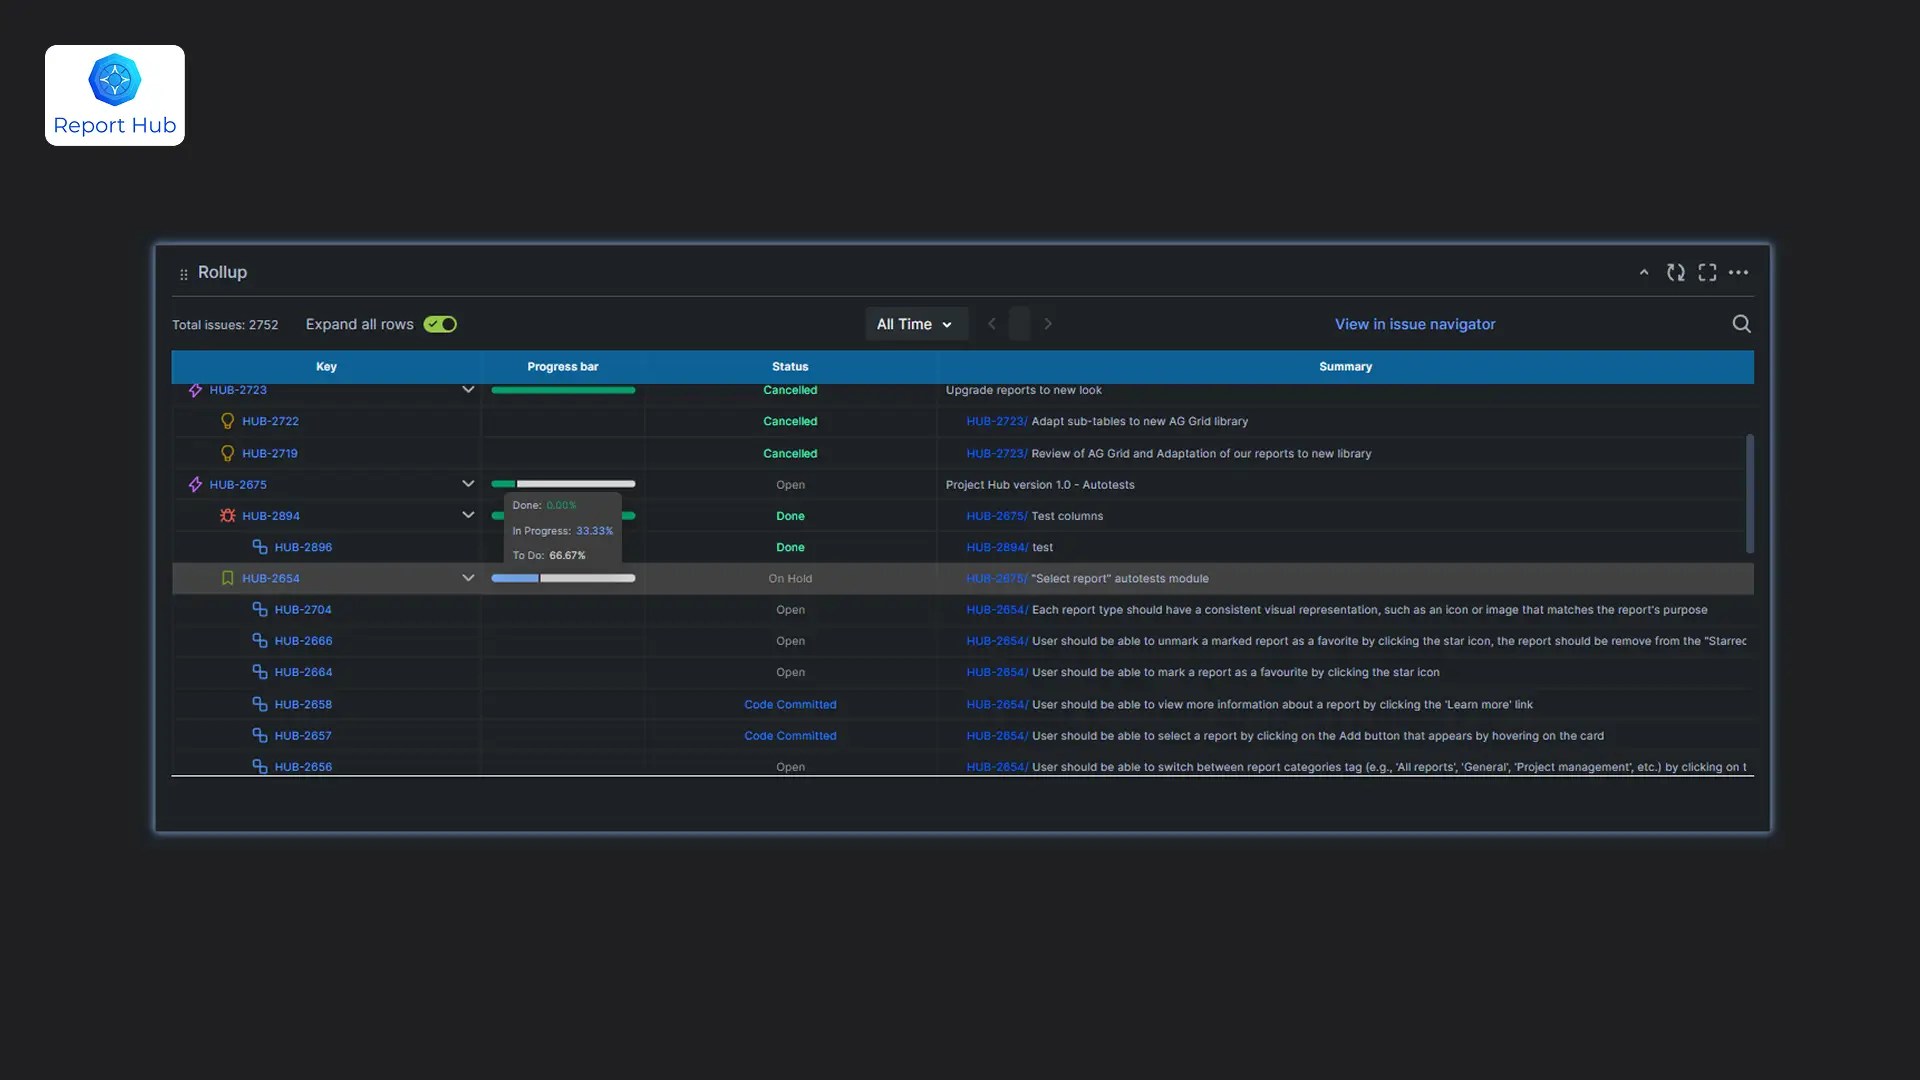
Report Hub is a collection of ready-made structured reports inside Jira Cloud. You open a specific analytical tool instead of assembling it manually.
In Jira Dashboards, every new management request usually means creating a new filter, configuring a gadget, validating JQL, and restructuring the dashboard layout.
Report Hub does not require assembling widgets. Burndown, Created vs Resolved, Workload per Sprint, Estimation Accuracy, and Time Spent are separate, fully structured reports.
The difference is simple: Jira Dashboards are a builder; Report Hub is a ready-made toolkit.
In Jira Dashboards, you can display a burndown chart or a sprint issue list. But to analyze workload distribution or estimation accuracy, you need to combine multiple elements.
In Report Hub, each Agile metric has its own structured report:
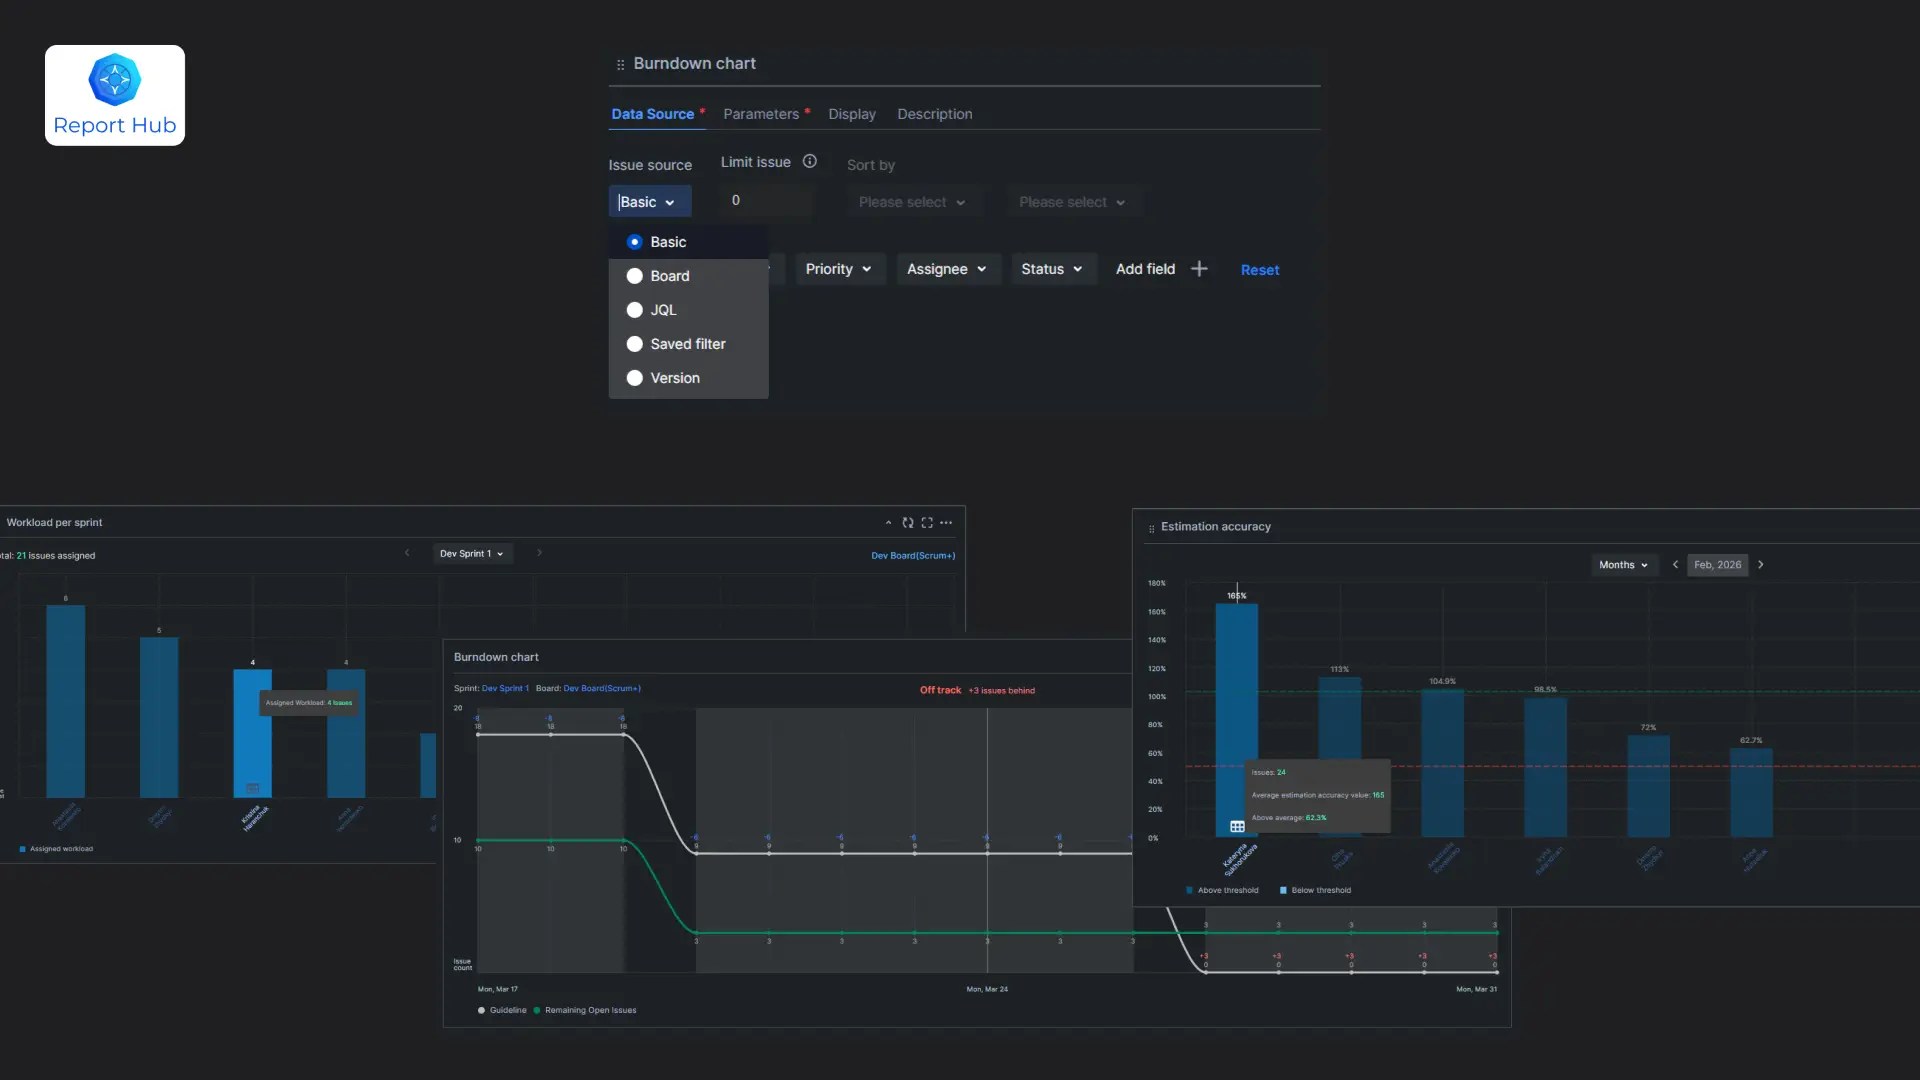
This allows teams to see not only status but also planning quality and workload balance.
In Jira Dashboards, time tracking typically appears as a table with a “Time Spent” column. For deeper analysis, data is often exported to spreadsheets.
In Report Hub, you have:
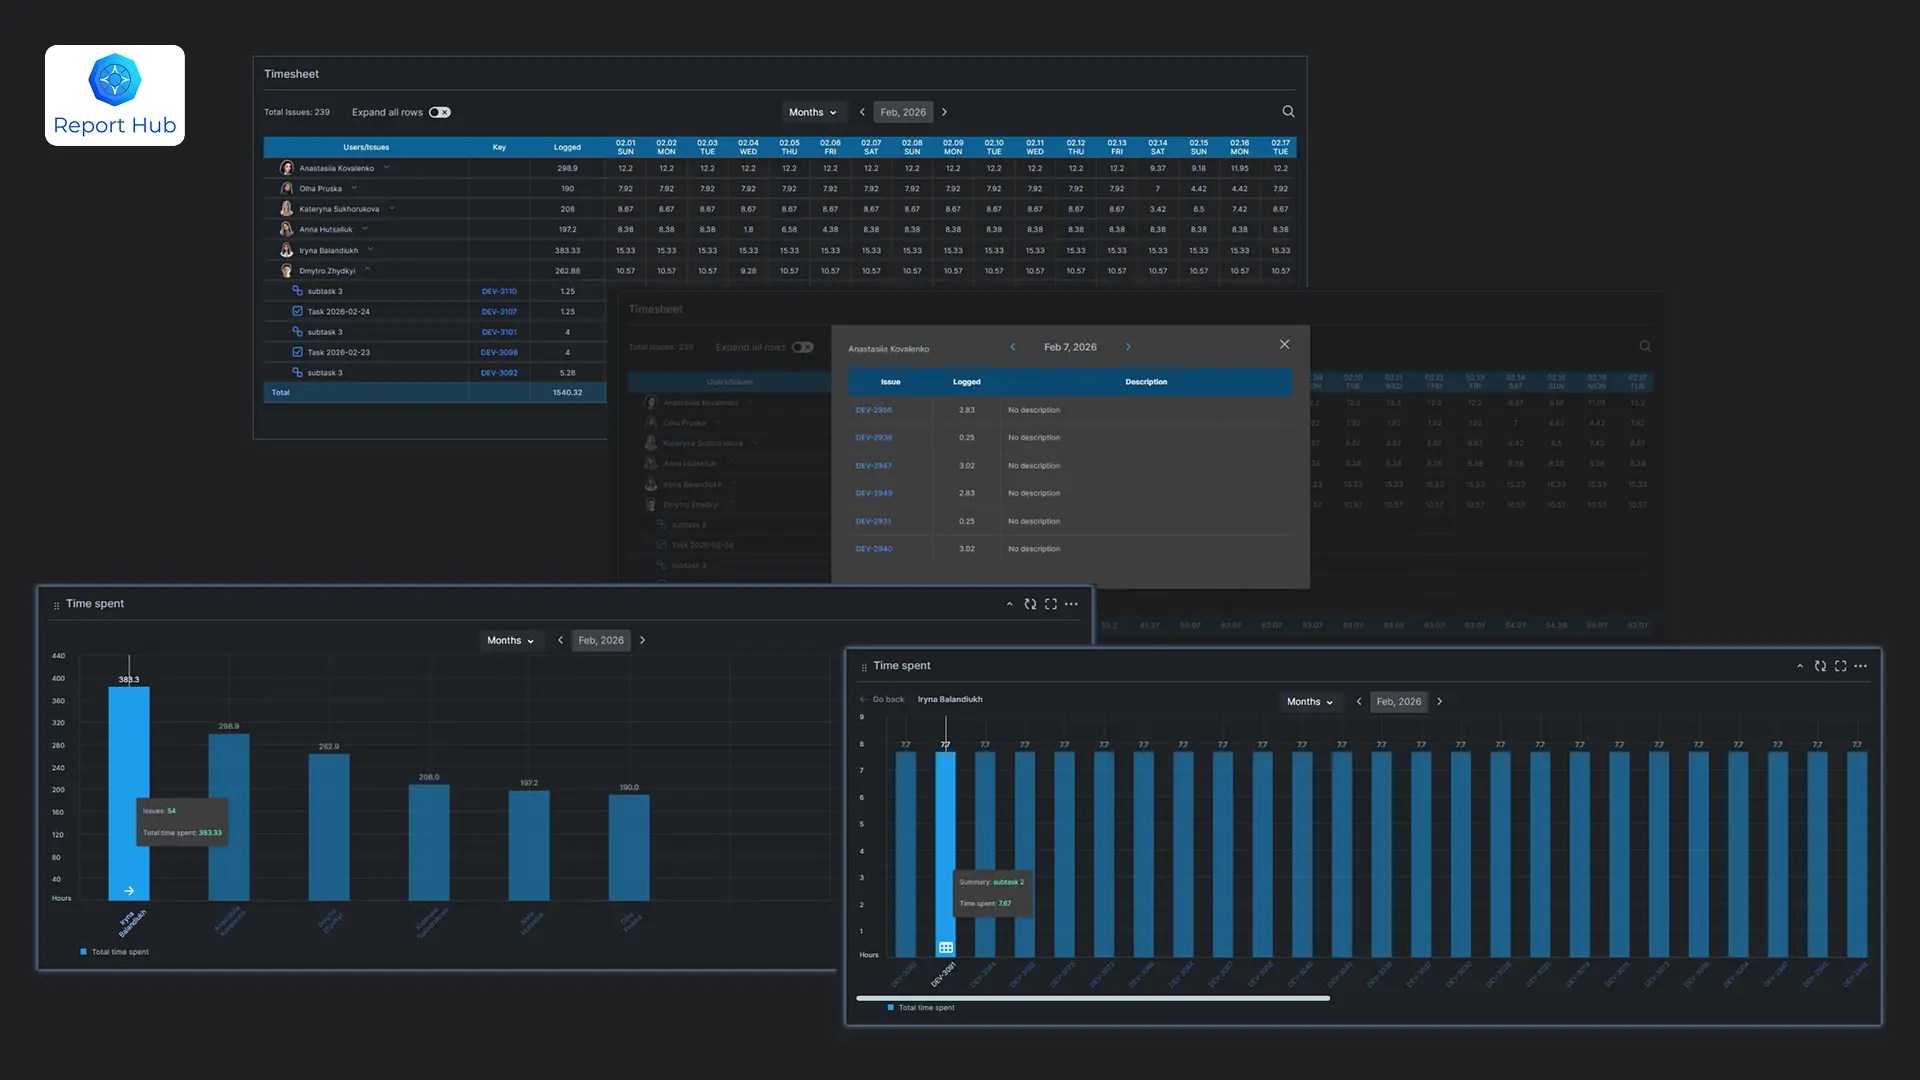
This reduces reliance on external spreadsheets. For a detailed guide on time tracking reports in Jira, see: Jira Time Tracking Reports: What’s Built In and What’s Missing.
Jira Dashboards do not automatically aggregate values across issue hierarchy levels. Report Hub includes a WBS report that provides roll-up visibility across levels.
For program-level management, this is critical.
In Jira Dashboards, cross-project reporting is built on complex filters that require ongoing maintenance. Report Hub uses the Hub concept — a centralized space for aggregated reporting across multiple projects.

Jira Dashboards are a flexible tool for basic visualization. They work well for simple scenarios.
Report Hub is a structured reporting solution for cases where you need:

If you are interested in other reporting alternatives, see: Best Jira Reporting Tools in 2026: Honest Comparison by a Jira Partner.
If your team spends more time configuring dashboards than analyzing results, it may be worth comparing both approaches in more detail.


Ready to Elevate Your Jira Setup?
Partner with Grandia Solutions to unlock expert configuration, reporting, and support services — tailored to your workflows. Whether you need custom dashboards, workflow automation, or long-term consulting, our team is here to make Jira work for you.